Volatility and Bonus Triggers: Data Patterns in Online Slot Gaming
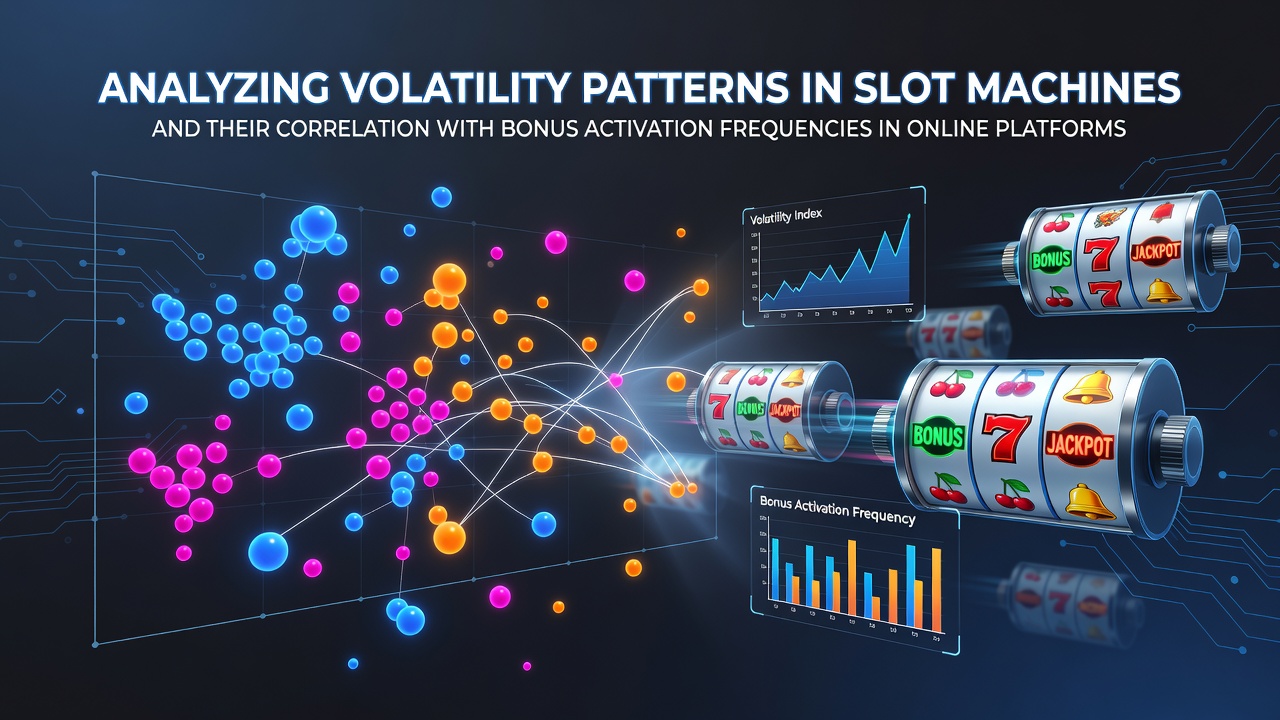
Online slot platforms track volatility through mathematical models that measure payout dispersion across thousands of spins, and these models show consistent relationships with how often bonus rounds activate. High-volatility titles tend to space out larger wins yet maintain specific trigger rates for free spins or multiplier features while lower-volatility games produce steadier base-game returns and more frequent but smaller bonus events.
Platform operators record these patterns through server-side logs that capture every spin outcome, and analysts aggregate the data to identify correlations between variance levels and bonus hit frequencies. Studies from the University of Nevada Reno Gaming Innovation Program have examined reel configurations across hundreds of titles and found that symbols designated as bonus triggers appear at rates calibrated to each game's volatility setting.
Measuring Volatility Through Standard Deviation Metrics
Volatility calculations rely on standard deviation applied to return distributions, and operators segment games into low, medium, and high categories based on these figures. Medium-volatility slots often cluster around a standard deviation range of 4.5 to 6.5 while high-volatility options exceed 8.0, according to aggregated industry datasets released in early 2026. These segments influence how frequently bonus symbols must land on active paylines to launch secondary features.
Engineers design reel strips so that bonus activation probabilities align with the intended variance profile, and this alignment produces measurable outcomes across player sessions. Data collected from major platforms during July 2026 indicated that high-volatility games averaged one bonus activation every 180 spins whereas medium-volatility titles triggered every 95 spins on average.
Correlation Patterns Across Game Categories
Statistical reviews reveal that bonus activation frequency rises in direct proportion to decreases in volatility when other parameters remain constant. Progressive jackpot slots, which usually carry the highest volatility ratings, show the lowest bonus hit rates because their prize pools depend on rare large payouts rather than repeated feature entries.
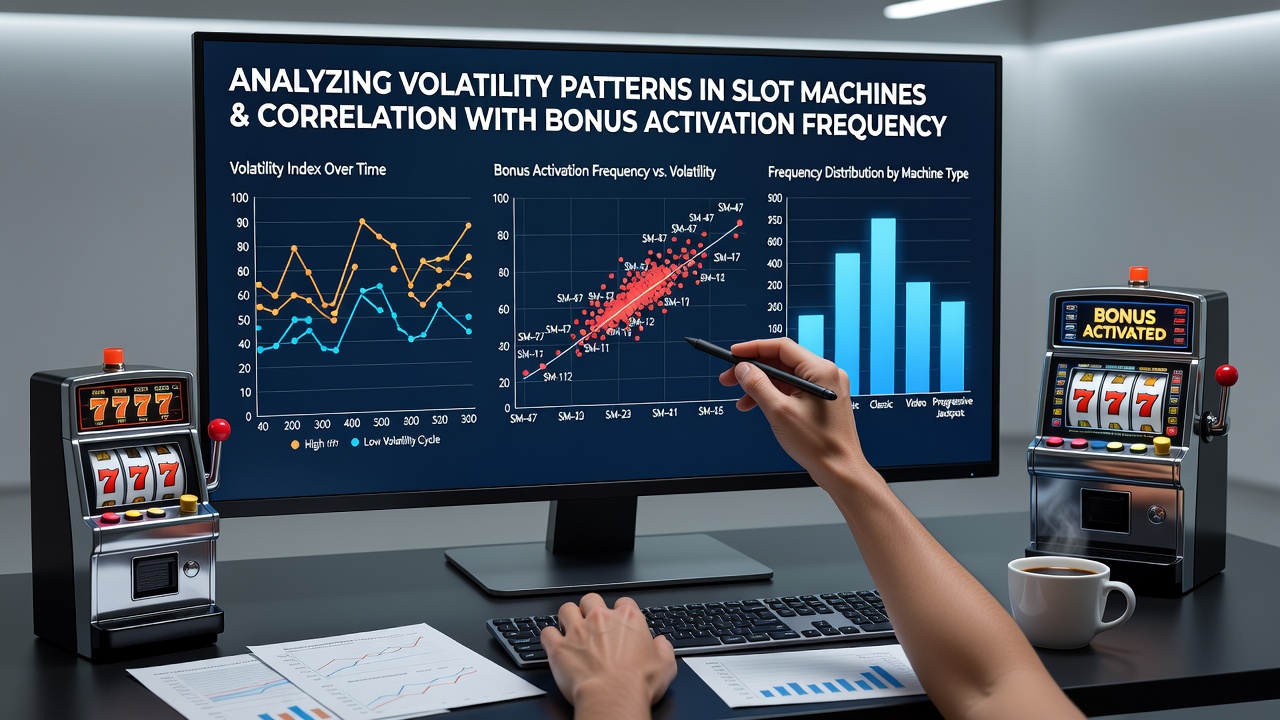
Fixed-reel and cluster-pay formats follow similar patterns once volatility settings are applied, and regulators in New Jersey have required operators to publish volatility classifications alongside RTP figures since 2024. This transparency allows players to select games that match preferred session lengths and bonus encounter expectations.
Platform-Level Data Aggregation Methods
Online operators compile anonymized spin data across millions of sessions to validate internal models, and external auditors cross-check these figures against theoretical distributions. Canadian regulatory reports from the Alcohol and Gaming Commission of Ontario document how variance adjustments affect bonus frequency compliance during game certification processes.
Developers adjust reel weighting and symbol distribution to maintain target activation rates, and any deviation triggers recalibration before wider release. The resulting datasets demonstrate that a 10 percent increase in volatility typically extends average bonus intervals by 25 to 35 spins when bonus symbol density stays unchanged.
Regional Regulatory Influences on Reporting Standards
European and North American jurisdictions apply different disclosure requirements yet converge on the need for accurate volatility documentation. The Malta Gaming Authority requires variance classification in technical submissions while Australian state regulators emphasize player information statements that include expected bonus intervals for high-variance titles.
These requirements have produced comparable datasets across borders, allowing researchers to compare activation frequencies between markets with distinct player demographics and game libraries. Cross-market analysis completed in mid-2026 confirmed that volatility-bonus correlations remain stable regardless of regional preference differences.
Conclusion
Volatility patterns in slot machines demonstrate reliable correlations with bonus activation frequencies when examined through large-scale platform data. Operators, regulators, and researchers continue to refine measurement techniques that link variance metrics directly to feature trigger rates, producing clearer expectations for game behavior across online environments.